While the season didn’t go according to plan, the Houston Gamblers did finish the season strong with two straight wins to finish 3-7 on the year.
Houston Gamblers Fast Start
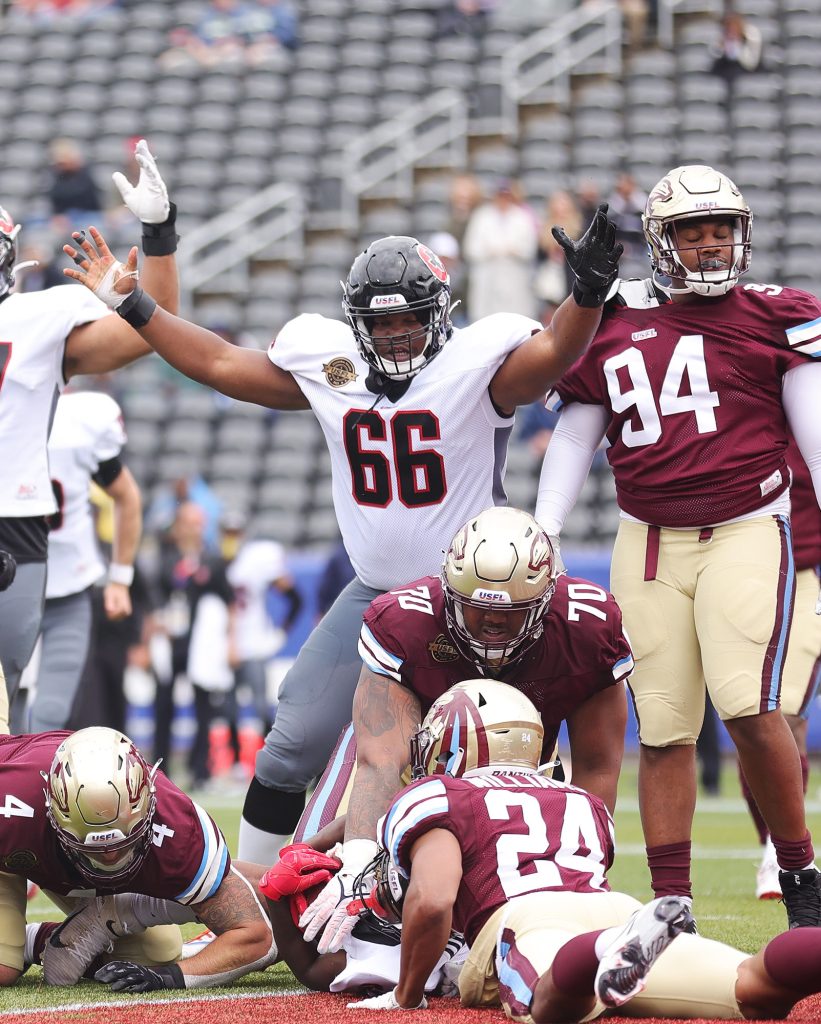
There were a lot of relative unknowns with the Houston Gamblers going into the season with questions surrounding the offense. No questions about the defense as many experts saw a lot of good talent from Houston’s defense with Donald Payne, Chris Odom, and Jamar Summers. Even having a big-name head coach in Kevin Sumlin brought some excitement for Houston and the USFL. Questions arose about how the offense would fair with Clayton Thorson leading the way at quarterback.
While game one wasn’t pretty, fans saw quickly how good the defense would be as they held the Michigan Panthers to zero points in the first half. Even the offense was looking pretty good with running back Mark Thompson making his presence known. After a late defensive stop in the fourth quarter, the Gamblers would hold on for a 17-12 win over the Panthers to start the season with a 1-0 record.
Things were looking up for the season as fans discovered Thompson as a key piece to the offense with how well he ran the football. The defense gave fans encouragement that even if the offense struggles, they can keep them in games. All that hope would vanish quickly over the next seven games as the Gamblers would break the hearts of fans over and over again.
Houston, We Have Seven Problems
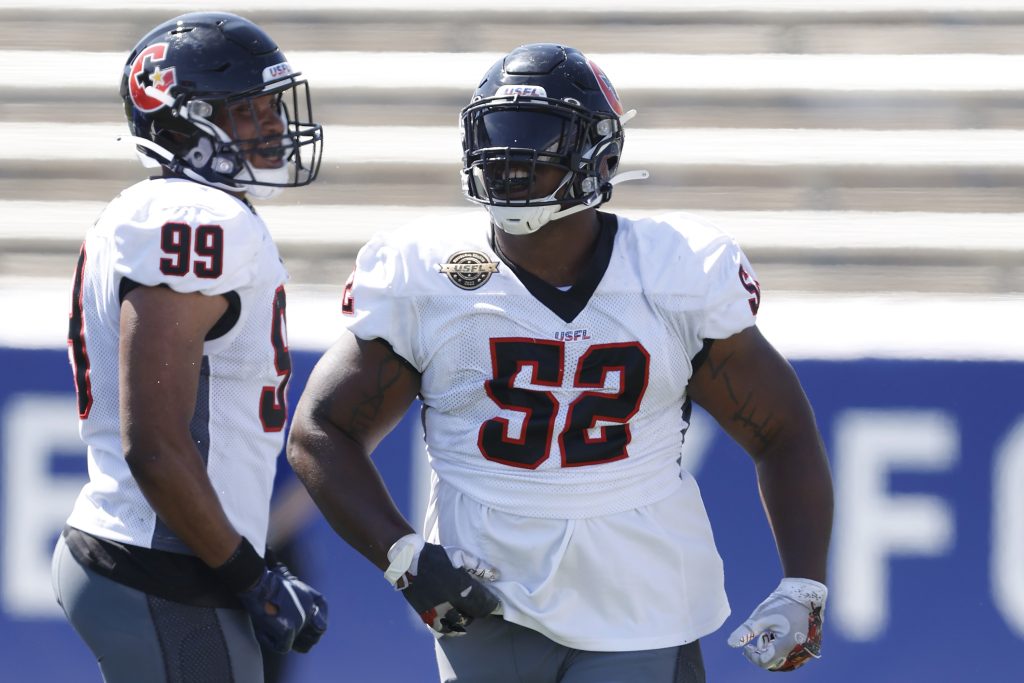
Some would argue that the first game of the upcoming seven-game losing streak was one that Houston lost up front as they were taken down by the Birmingham Stallions 33-28. An early interception by Thorson in that game would set the tone for a loss for Houston. What would happen in the next five games would be something that not many football fans have ever seen.
From week three until week seven, Houston would go into the fourth quarter in all those games with the lead and blow those leads resulting in losses. The Bandits defeated them with a field goal with 20 seconds left, the Breakers scored a game-winning touchdown pass with 10 seconds left, the Maulers scored a touchdown pass as time expired, and the Generals scored the game-winning touchdown on a quarterback sneak with no time remaining, and the Stars scored 22 unanswered points in the fourth quarter to beat Houston.
Houston was one of the best teams in the league in the first three quarters but struggled mightily to finish games in the fourth quarter. The defense allowed too many big plays and the offense never executed on drives late in games.
Time of possession was never a stat that the Gamblers led in during the losing streak. While Thompson’s running game helped keep Houston’s offense afloat in the first half, he lost his mojo in the second half of the season. It was Thorson who was able to pick up the slack and keep Houston in games.
The last game of the seven-game losing streak was an embarrassing 13-3 loss to Tampa Bay with Thorson no longer in the lineup and Thompson banged up. It was Kenji Bahar’s first start and while it was a loss, he showed promise for the rest of the season. The defense had one of their best performances of the season as they would finally hit their stride going into the last two games of the year.
Finishing on a High Note
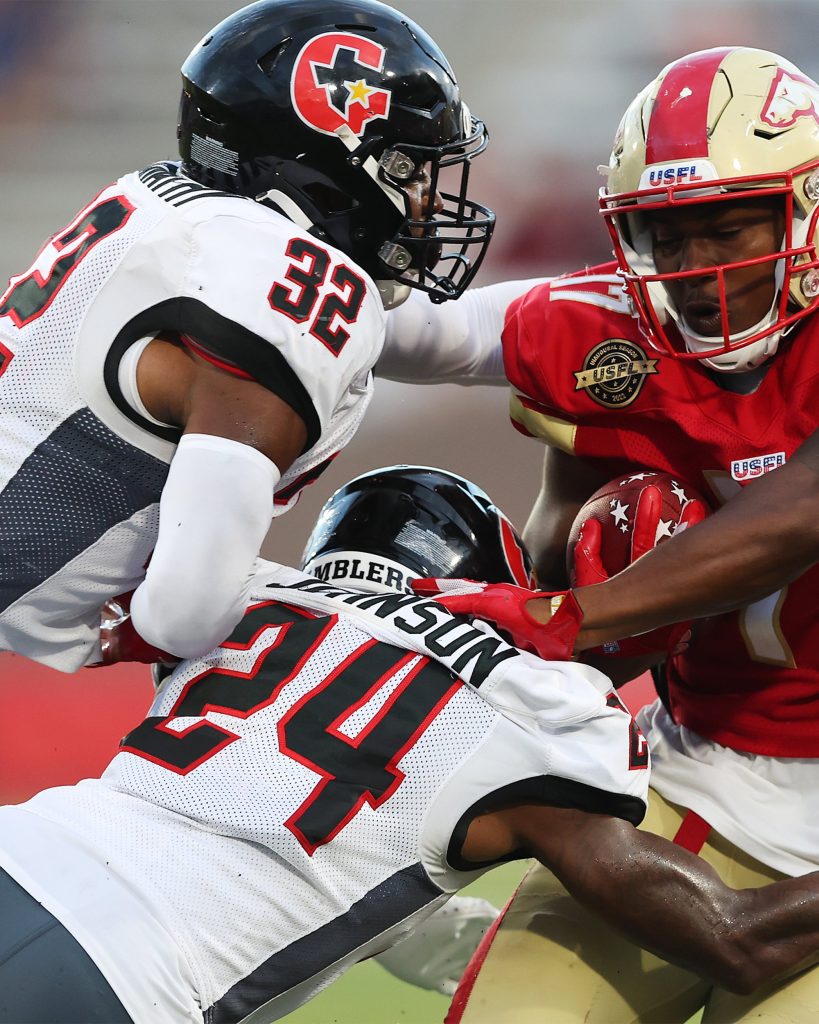
With Houston officially out of the playoff picture going into week nine, there was nothing left to lose for the Gamblers. They faced the undefeated Birmingham Stallions where the defense shut down the Stallions’ high-powered running game. Bahar played well with no turnovers and led the team in passing and rushing. It was a late interception by Houston that led to the biggest upset of the season with the Gamblers stealing a 17-15 win over Birmingham.
Now Houston had momentum going into the final week of the season against the New Orleans Breakers and they didn’t disappoint. It was the defense and special teams who stole the show holding the Breakers to 116 total yards of offense and scoring on an interception, two field goals, and a blocked field goal. The Gamblers got their revenge on New Orleans scoring a 20-3 win to finish the season with two consecutive wins.
Houston Gamblers Season Overview
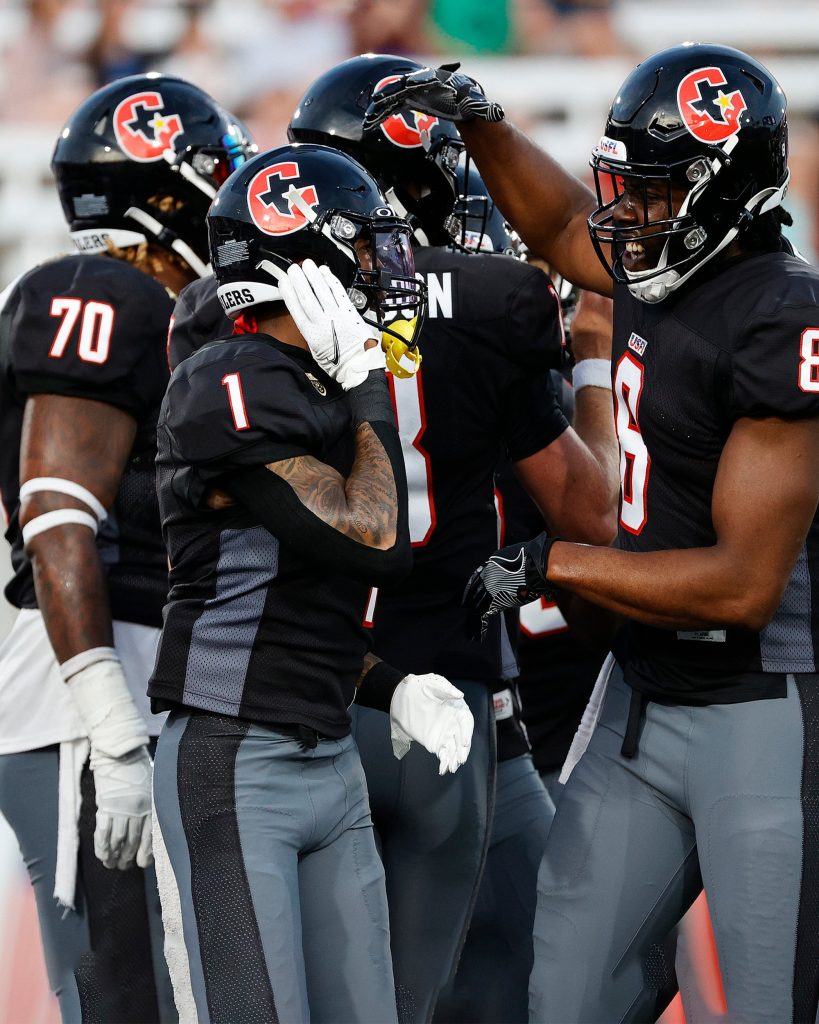
Houston finished the season with a 3-7 record and did finish last in the South Division. The season in general was a disappointment mostly because of what it could have been for Houston. If Houston didn’t blow any fourth-quarter leads, they would have finished the season with seven or eight wins and be playing Birmingham in the playoffs instead of New Orleans.
The offense was never great and was up and down all season. Their first half of the season was all about Mark Thompson leading the league in rushing and carrying the offense. The second half saw the death of the running game and Bahar willing his way through the air and on the ground. Isaiah Zuber became an impactful player on offense being the top playmaker at receive and dominating in all receiving stats for the team.
As for the defense, it was an odd season as individual players were great, but the unit, in general, didn’t play well until the last three weeks of the season. Defensive player of the year Chris Odom proved to be dominant throughout the season leading the league in sacks and could be finding his way to the NFL. Donald Payne led the USFL in tackles as he played well in stopping the run as well as making an impact in pass coverage. Jamar Summers was not quite the shutdown corner fans were hoping for, but it was Will Likely who stepped up and was top five in the USFL in interceptions.
Houston’s Most Valuable Player: Chris Odom
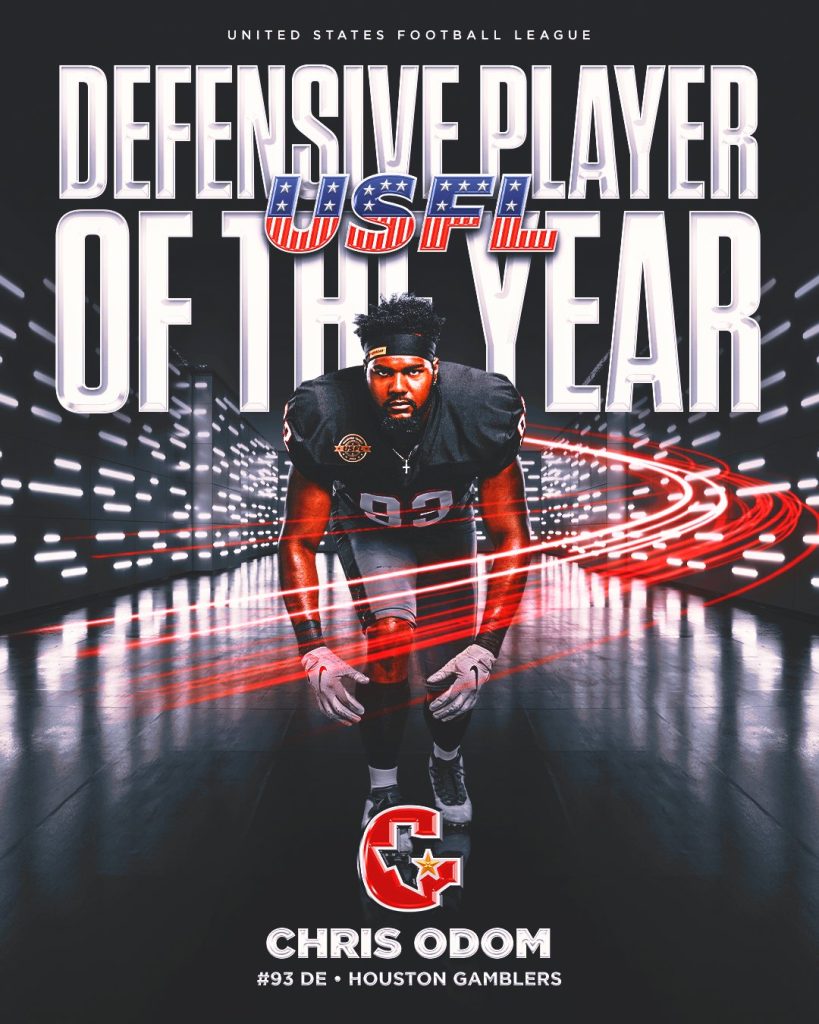
There wasn’t another defensive player in the league who dominated the USFL as much as Chris Odom did. It was rare to see an offensive lineman blocking him on their own. Most times he had to have two players blocking him at one time to contain him.
Odom finished the season as the league’s leader in sacks with 12.5 in ten games. He added 41 tackles, eight tackles for a loss, six forced fumbles, and one pass deflection. On special teams, Odom was able to contribute in a big way with four field goal blocks during the season to also lead the USFL.
It would be surprising to many if Odom doesn’t get some looks from the NFL to play in the upcoming season. He proved that he has earned his way back into the league. Even if he doesn’t get into the NFL, Houston will no doubt do everything they can to bring him back for another season. Odom was the most important part of the team and without his impact, the Gamblers might have done worst than they did.
Houston Gamblers Season Player Stats
Passing
| PLAYERS | GP | GS | COMP | ATT | ATT/G | PCT | PYDS | PAVG | PYDS/G | PTD | LNG | INT | SCK | SCKYDS | QBR |
|---|
| 1 | C. ThorsonQB | 7 | 7 | 85 | 149 | 21.3 | 57.0 | 987 | 6.6 | 141.0 | 10 | 48 | 7 | 4 | 27 | 125.4 |
| 2 | K. BaharQB | 7 | 3 | 61 | 100 | 14.3 | 61.0 | 541 | 5.4 | 77.3 | 2 | 45 | 2 | 14 | 73 | 109.0 |
| 3 | A. Ratliff-WilliamsWR | 10 | 3 | 0 | 1 | 0.1 | 0.0 | 0 | 0.0 | 0.0 | 0 | 0 | 0 | 0 | 0 | 0.0 |
| 4 | T. WilsonQB | 1 | 0 | – | – | – | – | – | – | – | – | – | – | – | – | – |
Rushing
| PLAYERS | GP | GS | ATT | ATT/G | RYDS | RAVG | RYDS/G | RTD | LNG | 100+ | FUM | FUML |
|---|
| 1 | M. ThompsonRB | 9 | 7 | 114 | 12.7 | 463 | 4.1 | 51.4 | 2 | 55 | 0 | 0 | 0 |
| 2 | D. DawkinsRB | 7 | 0 | 43 | 6.1 | 135 | 3.1 | 19.3 | 0 | 12 | 0 | 0 | 0 |
| 3 | K. BaharQB | 7 | 3 | 20 | 2.9 | 87 | 4.3 | 12.4 | 0 | 19 | 0 | 4 | 2 |
| 4 | D. WhaleyRB | 5 | 3 | 32 | 6.4 | 72 | 2.3 | 14.4 | 0 | 8 | 0 | 0 | 0 |
| 5 | C. ThorsonQB | 7 | 7 | 16 | 2.3 | 71 | 4.4 | 10.1 | 1 | 13 | 0 | 3 | 2 |
| 6 | B. LeMayRB | 2 | 0 | 16 | 8.0 | 57 | 3.6 | 28.5 | 0 | 14 | 0 | 0 | 0 |
| 7 | T. SimmonsWR | 4 | 3 | 3 | 0.8 | 13 | 4.3 | 3.3 | 0 | 11 | 0 | 0 | 0 |
| 8 | A. Ratliff-WilliamsWR | 10 | 3 | 1 | 0.1 | 3 | 3.0 | 0.3 | 0 | 3 | 0 | 1 | 0 |
Receiving
| PLAYERS | GP | GS | TGT | DROP | REC | PCT | RECYDS | YAC | RECAVG | YDS/G | RECTD | LNG |
|---|
| 1 | I. ZuberWR | 9 | 9 | 40 | 0 | 22 | 55.0 | 322 | 112 | 14.6 | 35.8 | 5 | 45 |
| 2 | T. ReddingWR | 7 | 6 | 25 | 0 | 17 | 68.0 | 249 | 66 | 14.6 | 35.6 | 1 | 48 |
| 3 | A. Ratliff-WilliamsWR | 10 | 3 | 42 | 0 | 28 | 66.7 | 243 | 109 | 8.7 | 24.3 | 1 | 41 |
| 4 | T. PalkaWR | 10 | 2 | 32 | 0 | 18 | 56.3 | 188 | 60 | 10.4 | 18.8 | 0 | 28 |
| 5 | J. AllenTE | 10 | 6 | 17 | 0 | 10 | 58.8 | 116 | 24 | 11.6 | 11.6 | 0 | 32 |
| 6 | J. WardWR | 7 | 2 | 23 | 0 | 16 | 69.6 | 110 | 74 | 6.9 | 15.7 | 1 | 30 |
| 7 | T. SimmonsWR | 4 | 3 | 22 | 0 | 8 | 36.4 | 89 | 28 | 11.1 | 22.3 | 1 | 44 |
| 8 | B. BarnesTE | 10 | 9 | 15 | 0 | 8 | 53.3 | 75 | 35 | 9.4 | 7.5 | 1 | 18 |
| 9 | D. WhaleyRB | 5 | 3 | 8 | 0 | 6 | 75.0 | 44 | 40 | 7.3 | 8.8 | 0 | 15 |
| 10 | M. ThompsonRB | 9 | 7 | 11 | 0 | 7 | 63.6 | 40 | 31 | 5.7 | 4.4 | 2 | 19 |
| 11 | B. LeMayRB | 2 | 0 | 3 | 0 | 3 | 100.0 | 26 | 19 | 8.7 | 13.0 | 0 | 13 |
| 12 | D. DawkinsRB | 7 | 0 | 6 | 0 | 3 | 50.0 | 26 | 22 | 8.7 | 3.7 | 0 | 14 |
| 13 | J. PedersonTE | 0 | 0 | – | – | – | – | – | – | – | – | – | – |
Defense
| PLAYERS | GP | SOLO | AST | TCKL | TFL | SCK | YDS | INT | INTTD | YDS | LNG | FF | REC | TD | PDEF | HUR | SFTY |
|---|
| 1 | D. PayneLB | 10 | 71 | 46 | 117 | 6 | 2.0 | 10 | 3 | 2 | 65 | 39 | 1 | 1 | 0 | 7 | 0.0 | 0 |
| 2 | R. NorthrupLB | 10 | 44 | 37 | 81 | 3 | 0.0 | 0 | 0 | 0 | 0 | 0 | 1 | 2 | 2 | 1 | 0.0 | 0 |
| 3 | M. AbernathyCB | 10 | 45 | 23 | 68 | 2 | 0.5 | 3 | 2 | 0 | 9 | 9 | 1 | 1 | 0 | 7 | 0.0 | 0 |
| 4 | W. LikelyCB | 10 | 47 | 16 | 63 | 3 | 0.5 | 2 | 4 | 1 | 87 | 62 | 2 | 2 | 0 | 8 | 0.0 | 0 |
| 5 | D. DavisDT | 10 | 24 | 33 | 57 | 3 | 3.5 | 22 | 0 | 0 | 0 | 0 | 0 | 0 | 0 | 1 | 0.0 | 0 |
| 6 | A. GoodenDE | 10 | 32 | 15 | 47 | 5 | 4.0 | 18 | 0 | 0 | 0 | 0 | 3 | 0 | 0 | 0 | 0.0 | 0 |
| 7 | C. OdomDE | 10 | 29 | 12 | 41 | 8 | 12.5 | 91 | 0 | 0 | 0 | 0 | 6 | 0 | 0 | 1 | 0.0 | 0 |
| 8 | M. BunchS | 8 | 24 | 12 | 36 | 0 | 0.0 | 0 | 0 | 0 | 0 | 0 | 0 | 0 | 0 | 1 | 0.0 | 0 |
| 9 | J. SummersCB | 8 | 24 | 2 | 26 | 2 | 0.0 | 0 | 0 | 0 | 0 | 0 | 0 | 1 | 0 | 4 | 0.0 | 0 |
| 10 | C. ThomasDT | 10 | 8 | 15 | 23 | 1 | 0.0 | 0 | 0 | 0 | 0 | 0 | 0 | 0 | 0 | 1 | 0.0 | 0 |
| 11 | J. JohnsonDB | 7 | 16 | 6 | 22 | 1 | 0.0 | 0 | 1 | 0 | 0 | 0 | 0 | 0 | 0 | 3 | 0.0 | 0 |
| 12 | T. LaulileDT | 10 | 12 | 9 | 21 | 5 | 0.5 | 2 | 0 | 0 | 0 | 0 | 0 | 2 | 2 | 1 | 0.0 | 0 |
| 13 | A. HolderS | 8 | 12 | 7 | 19 | 0 | 0.0 | 0 | 1 | 0 | 0 | 0 | 0 | 0 | 0 | 2 | 0.0 | 0 |
| 14 | J. IvieDT | 8 | 9 | 9 | 18 | 2 | 2.0 | 13 | 0 | 0 | 0 | 0 | 0 | 0 | 0 | 0 | 0.0 | 0 |
| 15 | B. BrownLB | 6 | 9 | 6 | 15 | 1 | 0.5 | 2 | 1 | 0 | 8 | 8 | 0 | 0 | 0 | 2 | 0.0 | 0 |
| 16 | D. BrownDE | 5 | 9 | 4 | 13 | 1 | 0.0 | 0 | 0 | 0 | 0 | 0 | 0 | 0 | 0 | 0 | 0.0 | 0 |
| 17 | D. LewisLB | 8 | 6 | 7 | 13 | 0 | 0.0 | 0 | 0 | 0 | 0 | 0 | 0 | 0 | 0 | 0 | 0.0 | 0 |
| 18 | B. KnightenCB | 3 | 9 | 2 | 11 | 0 | 0.0 | 0 | 1 | 0 | 7 | 7 | 0 | 0 | 0 | 3 | 0.0 | 0 |
| 19 | A. SorohS | 10 | 8 | 1 | 9 | 1 | 0.0 | 0 | 0 | 0 | 0 | 0 | 0 | 0 | 0 | 0 | 0.0 | 0 |
| 20 | J. AveryDT | 2 | 3 | 2 | 5 | 1 | 0.0 | 0 | 0 | 0 | 0 | 0 | 0 | 0 | 0 | 0 | 0.0 | 0 |
| 21 | R. WhiteCB | 2 | 3 | 2 | 5 | 0 | 0.0 | 0 | 0 | 0 | 0 | 0 | 0 | 0 | 0 | 0 | 0.0 | 0 |
| 22 | K. SokoliOL | 10 | 3 | 0 | 3 | 1 | 0.0 | 0 | 0 | 0 | 0 | 0 | 0 | 0 | 0 | 0 | 0.0 | 0 |
| 23 | T. PalkaWR | 10 | 3 | 0 | 3 | 0 | 0.0 | 0 | 0 | 0 | 0 | 0 | 0 | 0 | 0 | 0 | 0.0 | 0 |
| 24 | I. ZuberWR | 9 | 1 | 0 | 1 | 0 | 0.0 | 0 | 0 | 0 | 0 | 0 | 0 | 0 | 0 | 0 | 0.0 | 0 |
| 25 | J. CantaveCB | 2 | 1 | 0 | 1 | 0 | 0.0 | 0 | 0 | 0 | 0 | 0 | 0 | 0 | 0 | 0 | 0.0 | 0 |
| 26 | M. ThompsonRB | 9 | 1 | 0 | 1 | 0 | 0.0 | 0 | 0 | 0 | 0 | 0 | 0 | 0 | 0 | 0 | 0.0 | 0 |
| 27 | T. ReddingWR | 7 | 1 | 0 | 1 | 0 | 0.0 | 0 | 0 | 0 | 0 | 0 | 0 | 0 | 0 | 0 | 0.0 | 0 |
| 28 | T. PrescodOL | 9 | 1 | 0 | 1 | 0 | 0.0 | 0 | 0 | 0 | 0 | 0 | 0 | 0 | 0 | 0 | 0.0 | 0 |
Kicking
| PLAYERS | GP | PTS | FGM | FGA | PCT | LNG | XPM | XPA | PCT |
|---|
| 1 | N. VogelK | 10 | 66 | 18 | 23 | 78.0 | 53 | 12 | 15 | 80.0 |
Punting/Kickoff
| PLAYERS | GP | KO | YDS | K-AVG | TB | TB % | OSKA | OSK | AVG | PUNTS | YDS | P-AVG | LNG | IN20 | IN20% | TB | TB % | BLK | NET AVG |
|---|
Kickoff/Punt Return
| PLAYERS | GP | K-RET | K-RET YDS | K-RET AVG | TD | LNG | P-RET | P-RET YDS | P-RET AVG | TD | LNG |
|---|
| 1 | I. ZuberWR | 9 | 18 | 425 | 23.6 | 0 | 42 | 2 | 8 | 4.0 | 0 | 5 |
| 2 | J. WardWR | 7 | 15 | 404 | 26.9 | 0 | 58 | 0 | 0 | – | 0 | 0 |
| 3 | W. LikelyCB | 10 | 7 | 143 | 20.4 | 0 | 32 | 9 | 110 | 12.2 | 0 | 40 |
| 4 | A. Ratliff-WilliamsWR | 10 | 1 | 15 | 15.0 | 0 | 15 | 0 | 0 | – | 0 | 0 |
All-Purpose Yards
| PLAYERS | GP | AP YDS | AP YDS/G | YDS SCM | YDS SCM/G | RUSH YDS | RUSH AVG | RUSH YDS/G | REC YDS | REC AVG | REC YDS/G | K-RET YDS | K-RET AVG | P-RET YDS | P-RET AVG |
|---|
| 1 | I. ZuberWR | 9 | 755 | 83.9 | 322 | 35.8 | – | – | – | 322 | 14.6 | 35.8 | 425 | 23.6 | 8 | 4.0 |
| 2 | J. WardWR | 7 | 514 | 73.4 | 110 | 15.7 | – | – | – | 110 | 6.9 | 15.7 | 404 | 26.9 | 0 | – |
| 3 | M. ThompsonRB | 9 | 503 | 55.9 | 503 | 55.9 | 463 | 4.1 | 51.4 | 40 | 5.7 | 4.4 | – | – | – | – |
| 4 | A. Ratliff-WilliamsWR | 10 | 261 | 26.1 | 246 | 24.6 | 3 | 3.0 | 0.3 | 243 | 8.7 | 24.3 | 15 | 15.0 | 0 | – |
| 5 | W. LikelyCB | 10 | 253 | 25.3 | 0 | 0.0 | – | – | – | – | – | – | 143 | 20.4 | 110 | 12.2 |
| 6 | T. ReddingWR | 7 | 249 | 35.6 | 249 | 35.6 | – | – | – | 249 | 14.6 | 35.6 | – | – | – | – |
| 7 | T. PalkaWR | 10 | 188 | 18.8 | 188 | 18.8 | – | – | – | 188 | 10.4 | 18.8 | – | – | – | – |
| 8 | D. DawkinsRB | 7 | 161 | 23.0 | 161 | 23.0 | 135 | 3.1 | 19.3 | 26 | 8.7 | 3.7 | – | – | – | – |
| 9 | D. WhaleyRB | 5 | 116 | 23.2 | 116 | 23.2 | 72 | 2.3 | 14.4 | 44 | 7.3 | 8.8 | – | – | – | – |
| 10 | J. AllenTE | 10 | 116 | 11.6 | 116 | 11.6 | – | – | – | 116 | 11.6 | 11.6 | – | – | – | – |
| 11 | T. SimmonsWR | 4 | 102 | 25.5 | 102 | 25.5 | 13 | 4.3 | 3.3 | 89 | 11.1 | 22.3 | – | – | – | – |
| 12 | K. BaharQB | 7 | 87 | 12.4 | 87 | 12.4 | 87 | 4.3 | 12.4 | – | – | – | – | – | – | – |
| 13 | B. LeMayRB | 2 | 83 | 41.5 | 83 | 41.5 | 57 | 3.6 | 28.5 | 26 | 8.7 | 13.0 | – | – | – | – |
| 14 | B. BarnesTE | 10 | 75 | 7.5 | 75 | 7.5 | – | – | – | 75 | 9.4 | 7.5 | – | – | – | – |
| 15 | C. ThorsonQB | 7 | 71 | 10.1 | 71 | 10.1 | 71 | 4.4 | 10.1 | – | – | – | – | – | – | – |
Credentialed Reporter/Writer for XFL NewsHub, Writer for CFL NewsHub, Reporter/Writer for USFL NewsHub.


